 中文
 English

VBQA2606 MOSFET Replacement for SiR5607DP: Datasheet Columns
 Back to previous page

The original datasheet front page lists 0.007 Ω, 31.7 nC, and -90.9 A. The VBQA2606 front page lists 0.0060 Ω, 60 nC, and -80 A. Set side by side, the replacement looks lower in resistance and current, and twice as high in gate charge.
Those three pairs are not measured on the same basis. The original 0.007 Ω sits in the MAX column; the replacement's 0.0060 Ω sits in the TYP column with the maximum blank. The original's 31.7 nC is close to the -4.5 V gate figure; the replacement's 60 nC is the -10 V figure. The -90.9 A and -80 A are both case-temperature package limits, not board-level continuous ratings. Read the electrical tables line by line and the conclusion reverses in places.
The two devices share the same pinout, so the pin assignment does not change. The land pattern does.
Four Circuit Positions
| Position | Connection | Current range | Parameter that matters |
|---|---|---|---|
| Battery reverse protection | High side, source to battery positive, gate pulled by protection IC | 5 A to 30 A | Avalanche energy, gate-source rating |
| Load switch | High side, gate pulled down through a resistor by the MCU | 1 A to 15 A | Overdrive at 4.5 V gate drive |
| OR-ing diode replacement | One device in each supply path, source to the input | 10 A to 40 A | Body diode drop, reverse leakage |
| Motor and inductive load disconnect | High side, carries the induced voltage at turn-off | Up to 30 A peak | Avalanche, thermal resistance |
A 60 V rating leaves margin on 12 V, 24 V, and 48 V buses. OR-ing and inductive disconnect are the two cases that drive the voltage to its limit, which is why 60 V is chosen over 30 V.
Package and Pinout
| Item | SiR5607DP | VBQA2606 |
|---|---|---|
| Package name | PowerPAK SO-8 | DFN8(5X6) |
| Body size | 6.15 × 5.15 mm | 5 × 6 mm |
| Thickness | Not listed | Not listed |
| Pins 1-3 | Source | Source |
| Pin 4 | Gate | Gate |
| Pins 5-8 | Drain | Drain |
| Bottom pad | Drain | Drain |
The pin assignment matches: source, gate, and drain line up one to one, and the bottom pad connects to drain in both. The board can be populated in the same orientation without crossing traces.
The body sizes differ by about 1 mm in each direction. These are not the same land pattern. The first board revision needs the replacement's recommended footprint; the PowerPAK footprint cannot be reused. Reflow follows the leadless package profile with a 260 °C peak.
On-Resistance Column
| Item | SiR5607DP | VBQA2606 |
|---|---|---|
| Front-page 10 V resistance | 0.007 Ω, MAX column | 0.0060 Ω, TYP column |
| Table 10 V resistance (typ / max) | 5.6 / 7.0 mΩ | 6.0 mΩ / not listed |
| 10 V test current | -20 A | -10 A |
| Front-page 4.5 V resistance | 0.012 Ω, MAX column | 0.0075 Ω, TYP column |
| Table 4.5 V resistance (typ / max) | 9.2 / 12 mΩ | 7.5 mΩ / not listed |
| 125 °C junction (10 V) | Not listed | 12.0 mΩ typ |
| 175 °C junction (10 V) | Not listed | 15.0 mΩ typ |
The two front-page numbers sit in different columns. The original's 7.0 mΩ is a maximum; the replacement's 6.0 mΩ is a typical. Compared directly, the replacement looks 14 % lower. Compared typical to typical, the replacement is 6.0 mΩ against 5.6 mΩ, 7 % higher. The conclusion reverses.
The replacement is measured at -10 A against -20 A for the original. Lower test current gives a lower resistance reading, which favours the replacement; at 20 A the effective resistance needs the curve or a measurement.
Neither resistance maximum is listed for the replacement. For production, take typical plus 20 %: the 10 V figure becomes 7.2 mΩ, 3 % above the original's 7.0 mΩ maximum; the 4.5 V figure becomes 9.0 mΩ, below the original's 12 mΩ maximum. What the replacement lacks is a guaranteed maximum in the 10 V column.
The replacement also lists hot resistance: 12.0 mΩ at 125 °C and 15.0 mΩ at 175 °C, both at -10 A and -10 V. The original does not give numbers at those temperatures.
The product page lists ±20 V, -3 V, 6 mΩ, and -80 A. The datasheet gives a ±30 V gate rating and prints the threshold as 3 V. This article follows the datasheet; the parameter fields need checking.
Gate-Charge Bias
| Item | SiR5607DP | VBQA2606 |
|---|---|---|
| Front-page gate charge (typ) | 31.7 nC | 60 nC |
| 10 V gate (typ / max) | 74 / 112 nC | 60 / 100 nC |
| 4.5 V gate (typ / max) | 34.8 / 53 nC | Not listed |
| Charge test current | -20 A | -5 A |
| Test bus voltage | -30 V | -30 V |
| Gate-source charge | 18 nC typ | 9.5 nC typ |
| Gate-drain charge | 10.1 nC typ | 19 nC typ |
The original's 31.7 nC is close to the -4.5 V table figure of 34.8 nC; the replacement's 60 nC is the -10 V figure. The two front-page values use different gate drives. Compared directly, the replacement looks twice as high. Compared at the same -10 V gate, the replacement's 60 nC is 19 % below the original's 74 nC.
The replacement's charge is measured at -5 A against -20 A for the original. Gate charge tracks gate voltage and bus voltage more than drain current, so that 19 % carries more weight than the resistance comparison, but the conditions are still not identical. The replacement does not list a 4.5 V figure, so low-voltage drive needs a measurement.
Gate-drain charge is 19 nC for the replacement against 10.1 nC for the original, nearly double. The Miller plateau length follows this charge, and with it the dv/dt turn-on risk in bridge circuits. Total gate charge alone does not capture it.
At 200 kHz, using the -10 V table figures, gate-drive loss from Qg × VGS × f is about 0.148 W for the original and 0.12 W for the replacement. Peak source and sink current from the driver still has to be checked against gate-drain charge and switching time.
Capacitance Bias Voltage
| Item | SiR5607DP | VBQA2606 |
|---|---|---|
| Input capacitance | 5020 pF typ | 12000 pF typ |
| Input capacitance bias | VDS = -30 V | VGS = 0 V, hence VDS = 0 V |
| Output capacitance | 2050 pF typ | 310 typ / 450 max pF |
| Output capacitance bias | VDS = -30 V | VDS = -25 V |
| Reverse transfer capacitance | 85 pF typ | 200 typ / 275 max pF |
| Reverse transfer capacitance bias | VDS = -30 V | VDS = -25 V |
The replacement's 12000 pF against 5020 pF looks 1.4 times higher, but the bias voltages differ. The replacement is measured at VGS = 0 V, meaning VDS = 0 V, the point where input capacitance peaks. The original is measured at -30 V, where the capacitance has already fallen with reverse bias. The replacement has no -30 V figure; same-condition data is not listed.
Output capacitance goes the other way: 310 pF for the replacement against 2050 pF for the original, with test voltages of -25 V and -30 V, close enough to compare. One device having higher input capacitance and lower output capacitance shows why a single capacitance number does not describe either part; switching behaviour has to be read from Qgd and measured waveforms.
Reverse transfer capacitance is 200 pF against 85 pF, with -25 V and -30 V bias. Miller plateau length and dv/dt turn-on risk follow it. The replacement also gives a 275 pF maximum; the original leaves the maximum column blank.
The replacement's input-capacitance maximum column is blank, so production design has to work from the typical value with margin.
Current Rating Basis
| Item | SiR5607DP | VBQA2606 |
|---|---|---|
| Continuous current, case 25 °C | -90.9 A | -80 A |
| Continuous current, case 70 °C / 125 °C | -72.7 A at 70 °C | -64 A at 125 °C |
| Continuous current, ambient 25 °C | -22.2 A, 10 s | Not listed |
| Pulsed current | -250 A | -240 A |
| Max dissipation, case 25 °C | 104 W | 68 W |
| Max dissipation, ambient 25 °C | 6.25 W, 10 s | Not listed |
| Junction-to-ambient, 10 s | 15 typ / 20 max °C/W | Not listed |
| Junction-to-ambient, steady | 54 °C/W | 68 °C/W, 1 square inch board |
| Junction-to-case, steady | 0.9 typ / 1.2 max °C/W | 2.2 °C/W |
The original's absolute-maximum table header says TA = 25 °C, but the -90.9 A row is marked TC = 25 °C. At 25 °C ambient it is -22.2 A, and a footnote limits that to 10 s. The replacement's -80 A is also at TC = 25 °C and is package-limited. Neither case-current figure is what a board can carry continuously.
On a board, the original gives -22.2 A at 25 °C ambient for 10 s, with 54 °C/W for steady state. The replacement gives no ambient current, only 68 °C/W steady thermal resistance. At 175 °C junction and 25 °C ambient, the replacement can dissipate 2.2 W; with 10 V resistance rising to 15 mΩ at 175 °C, that is on the order of 12 A. The original's 150 °C limit and 54 °C/W give 2.3 W; at 5.6 mΩ that starts at 20 A and needs derating for the temperature rise. The two are the same order of magnitude on this basis.
Junction-to-case is 2.2 °C/W for the replacement against 0.9 typ / 1.2 max °C/W for the original. With a heatsink, the replacement drops more temperature across the interface, so the heatsink has to be selected again.
Gate Rating, Junction Temperature, Avalanche
| Item | SiR5607DP | VBQA2606 |
|---|---|---|
| Gate-source voltage | ±20 V | ±30 V |
| Threshold (min / typ / max) | -1.4 / not listed / -2.6 V | not listed / 3 V (no sign) / not listed |
| Junction temperature limit | 150 °C | 175 °C |
| Single-pulse avalanche energy | 125 mJ, L = 0.1 mH | 64.8 mJ, L = 0.1 mH |
| Avalanche current | -50 A, L = 0.1 mH | -36 A, L = 0.1 mH |
The replacement's ±30 V gate rating exceeds the original's ±20 V. On a 24 V bus, pulling the gate to ground brings the original close to its limit while the replacement keeps margin. That favours the replacement, but gate clamps still follow the driver's absolute maximum, not the MOSFET's 30 V rating.
Junction limit is 175 °C for the replacement and 150 °C for the original; high-temperature derating uses each own limit. The previous section already used both figures to estimate board-level current.
Avalanche is 64.8 mJ for the replacement against 125 mJ for the original, nearly half, with the same 0.1 mH inductance, so the two can be compared directly. Avalanche current is -36 A against -50 A. For inductive disconnect with no snubber, either add absorption or recalculate the single-pulse energy limit.
The replacement datasheet prints the threshold as 3 V with no minus sign; the product page says -3 V. A P-channel device should be negative, so confirm the value with the supplier. The original gives a -1.4 V minimum and -2.6 V maximum; the replacement gives only one typical number.
Switching Time Load Conditions
| Item | SiR5607DP | VBQA2606 |
|---|---|---|
| Turn-on delay (typ / max) | 18 / 36 ns | 15 / 25 ns |
| Rise time (typ / max) | 9 / 18 ns | 5 / 10 ns |
| Turn-off delay (typ / max) | 40 / 80 ns | 40 / 75 ns |
| Fall time (typ / max) | 9 / 18 ns | 6 / 12 ns |
| Test bus | -30 V | -30 V |
| External gate resistor | 1 Ω | 1 Ω |
| Test current | about -20 A | -5 A |
| Load resistance | 1.5 Ω | 6 Ω |
All four switching times are slightly shorter for the replacement, but it is measured at -5 A against -20 A, with load resistances of 6 Ω and 1.5 Ω. Lighter load and lower current switch faster, so these numbers are not evidence that the replacement is quicker. The bus and gate resistor do match, both -30 V and 1 Ω.
Neither part lists an internal gate resistance; the board resistor sets damping. To compare switching loss on the same drive, both parts have to be soldered to the same board and measured at the same current, bus, and gate resistance.
Three Options and When They Apply
First, 12 V or 24 V load switches and battery protection at 10 V drive and up to 200 kHz: the swap works if the board is redrawn for the replacement footprint. The 10 V typical resistance differs by 7 %, gate charge is 19 % lower, and the gate and junction limits are higher. What is missing is a resistance maximum; use 7.2 mΩ as the design value.
Second, 48 V OR-ing or switching above 500 kHz: measure first. The replacement's input capacitance and gate-drain charge are roughly double, and reverse transfer capacitance is 200 pF against 85 pF. Those sit on the margin of high-frequency and dv/dt-sensitive positions.
Third, inductive disconnect where turn-off has to absorb avalanche energy: do not use this part without a snubber, or re-rate it. The replacement's 64.8 mJ is half the original's. VBQA2611 is another route in the same package family, -60 V, -60 A, 11 mΩ, checked line by line in the previous article; for a lower voltage P-channel part, see VBQA2302.
Full Parameter Comparison
| Parameter | SiR5607DP | VBQA2606 |
|---|---|---|
| Package | PowerPAK SO-8 | DFN8(5X6) |
| Channel | P | P |
| Drain-source voltage | 60 V | 60 V |
| Gate-source voltage | ±20 V | ±30 V |
| Threshold (min / typ / max) | -1.4 / not listed / -2.6 V | not listed / 3 V (no sign) / not listed |
| 10 V resistance (typ / max) | 5.6 / 7.0 mΩ | 6.0 mΩ / not listed |
| 4.5 V resistance (typ / max) | 9.2 / 12 mΩ | 7.5 mΩ / not listed |
| Continuous current, case 25 °C | -90.9 A | -80 A |
| Continuous current, ambient 25 °C | -22.2 A, 10 s | Not listed |
| Pulsed current | -250 A | -240 A |
| Gate charge, 10 V (typ / max) | 74 / 112 nC | 60 / 100 nC |
| Gate charge, 4.5 V (typ / max) | 34.8 / 53 nC | Not listed |
| Gate-drain charge | 10.1 nC | 19 nC |
| Input capacitance (bias) | 5020 pF at -30 V | 12000 pF at 0 V |
| Output capacitance (bias) | 2050 pF at -30 V | 310 pF at -25 V |
| Reverse transfer capacitance (bias) | 85 pF at -30 V | 200 pF at -25 V |
| Turn-on / turn-off delay | 18 / 40 ns | 15 / 40 ns |
| Body diode drop (typ / max) | 0.76 / 1.1 V at -5 A | 0.80 / 1.2 V at -10 A |
| Reverse recovery charge | 85 nC typ | Not listed |
| Avalanche energy | 125 mJ | 64.8 mJ |
| Junction-to-ambient, steady | 54 °C/W | 68 °C/W |
| Junction-to-case | 0.9 typ / 1.2 max °C/W | 2.2 °C/W |
| Junction temperature range | -55 to 150 °C | -55 to 175 °C |
Other Options at the Same Voltage
VBQA2611 is a -60 V P-channel device in the same package family, -60 A and 11 mΩ, with 60 / 100 nC gate charge. Against this replacement it carries less current and higher resistance, but it is the part where two ordering codes share one electrical table, so its documentation is more complete. Below 20 A, both are worth checking.
VBQA2302 is a -30 V P-channel part at -120 A and 2.2 mΩ in the same DFN8(5X6) package. On buses under 24 V, the lower voltage rating buys substantially lower on-resistance than either part here.
Staying with the original is also an option. The replacement has no resistance maximum, no same-condition input capacitance or reverse recovery charge, and half the avalanche energy. An existing design at 10 V drive and under 20 A is cheaper to keep than to requalify.
Checks Before Replacement
- Footprint: pinout matches, but the body changes from 6.15 × 5.15 mm to 5 × 6 mm, so redraw the land pattern.
- Resistance: the replacement lists only typical values. Use 6.0 mΩ plus 20 % as 7.2 mΩ for the 10 V design value, 3 % above the original's 7.0 mΩ maximum.
- Product page fields: ±20 V, -3 V, 6 mΩ, -80 A. The datasheet gives ±30 V and prints the threshold as 3 V. Follow the datasheet and correct the fields.
- Charge: the original's 31.7 nC is near the -4.5 V figure; the replacement's 60 nC is -10 V. At the same -10 V gate, 60 nC against 74 nC.
- Capacitance: the replacement's 12000 pF is measured at 0 V bias, the original's 5020 pF at -30 V. Same-condition data is not listed.
- Current: both case-current figures are package limits. The replacement gives no ambient rating; at 68 °C/W and 175 °C junction, board-level steady current is on the order of 12 A.
- Thermal resistance: junction-to-case is 2.2 °C/W for the replacement against 0.9 typ / 1.2 max °C/W for the original. Recalculate with a heatsink.
- Avalanche: 64.8 mJ against 125 mJ, half the original. Add a snubber or lower the current limit for inductive loads.
- Threshold: the replacement prints 3 V with no sign, the product page says -3 V. Confirm with the supplier before using the value.
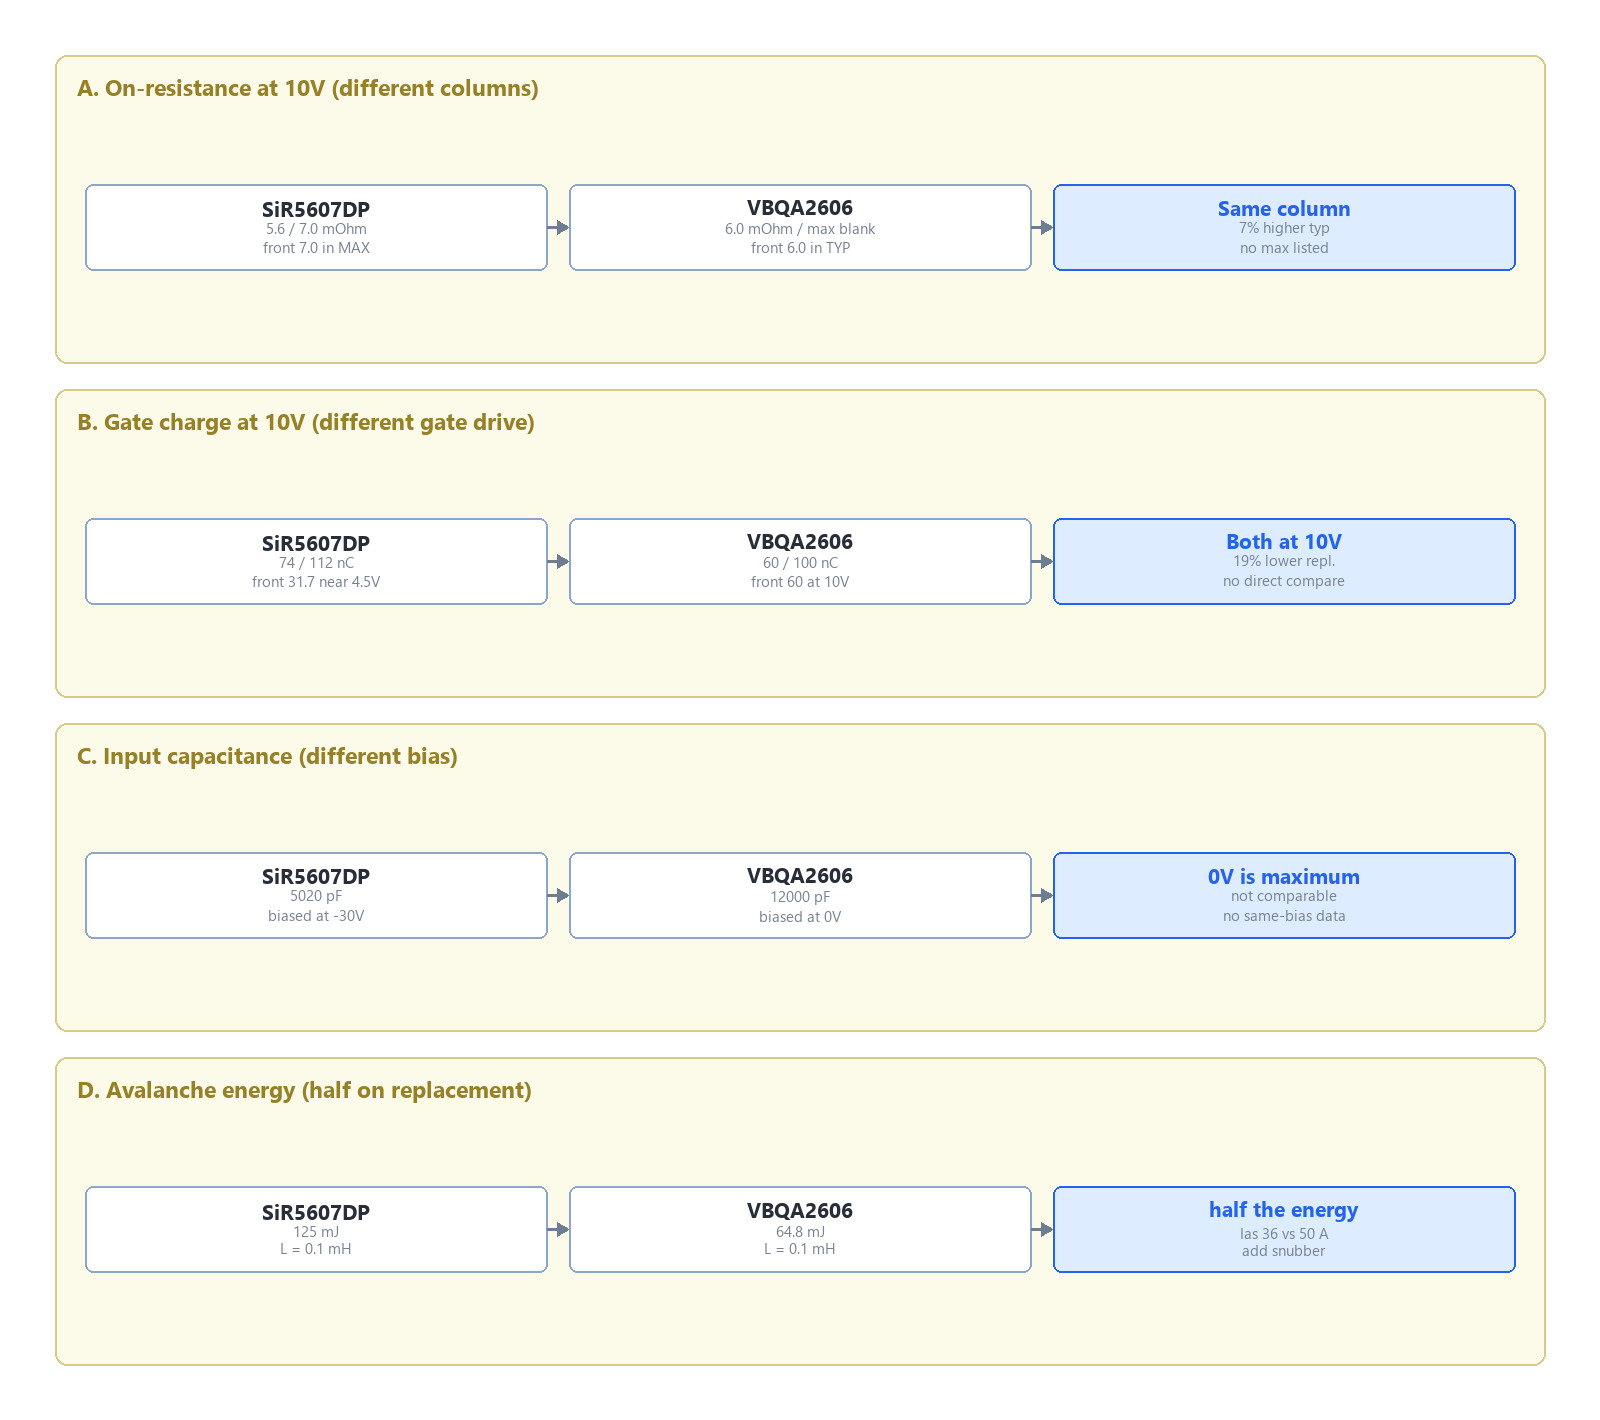
Figure 1. Three pairs of datasheet values side by side. On-resistance: the original front-page 7.0 mΩ is in the MAX column and the table gives 5.6 typ / 7.0 max mΩ; the replacement front-page 6.0 mΩ is in the TYP column with the maximum blank. Gate charge: the original front-page 31.7 nC is near the -4.5 V figure and the -10 V table gives 74 / 112 nC; the replacement front-page 60 nC is the -10 V figure at 60 / 100 nC. Input capacitance: 5020 pF at -30 V for the original against 12000 pF at 0 V for the replacement.
FAQ
Do the two devices share the same pinout?
Yes. Both use pins 1-3 for source, pin 4 for gate, pins 5-8 for drain, and the bottom pad for drain. The body sizes differ, so the land pattern still needs redrawing.
The front pages say 0.007 Ω and 0.0060 Ω. Is the replacement lower?
They are different columns. The original's 0.007 Ω is a maximum, the replacement's 0.0060 Ω is a typical. Compared typical to typical, the replacement is 6.0 mΩ against 5.6 mΩ, 7 % higher.
How should the design value be set without a resistance maximum?
Take typical plus 20 %, which gives 7.2 mΩ at 10 V. That is 3 % above the original's 7.0 mΩ maximum, before accounting for unit-to-unit spread.
Are the 31.7 nC and 60 nC on the front pages the same test?
No. The original's 31.7 nC is near the -4.5 V figure, the replacement's 60 nC is -10 V. At the same -10 V gate, the replacement's 60 nC is 19 % below the original's 74 nC.
Is 12000 pF against 5020 pF a fair comparison?
No. The replacement is measured at VDS = 0 V, where input capacitance peaks; the original at -30 V. The replacement's value at -30 V is not listed.
The replacement's avalanche energy is half. Can it be used in the same position?
The replacement is 64.8 mJ against 125 mJ, both at 0.1 mH, so they can be compared directly. Inductive disconnect positions need a snubber or a lower current limit.
The replacement's ±30 V gate rating is higher. Is that an upgrade?
There is more margin on a 24 V bus when the gate is pulled to ground. Gate clamps still follow the driver's rating; the 30 V figure does not loosen that requirement.
The product page lists ±20 V and 6 mΩ, which disagrees with the datasheet. Which one applies?
Use the datasheet: ±30 V, 6.0 mΩ typical at 10 V, and the threshold printed as 3 V. The parameter fields need correcting in the backend.

Download PDF document
 Download now


