 中文
 English

VBGQA1606 MOSFET Replacement for CSD18563Q5A: Test Conditions
 Back to previous page

The original datasheet front page lists 5.7 mΩ, 15 nC, 60 V and a SON 5 × 6 mm package. The VBGQA1606 datasheet front page lists 6 mΩ, 34 nC, 60 V and a DFN8(5 × 6) package. Side by side, the resistance looks similar and the gate charge looks twice as high.
Those four numbers were not measured under the same conditions. The resistance typical values are comparable, but only the original has a maximum. Gate charge was measured on a 30 V bus for one part and a 60 V bus for the other. Capacitance was measured at 30 V bias for one and 0 V for the other. Switching times were measured with 0 Ω external gate resistance on one and 2.5 Ω on the other. Reading the four rows separately shows which values can be carried over and which need recalculating.
The two devices share the same outline and pinout. The land pattern does not change.
Four Circuit Positions
| Position | Connection | Current range | What matters |
|---|---|---|---|
| Synchronous rectifier in an industrial buck converter | Low side, source to ground, gate driven by the sync controller | 10 A to 25 A | Gate charge, body-diode recovery charge |
| Motor drive low side | Source to shunt or ground, gate driven by a half-bridge driver | Up to 30 A peak | Avalanche energy, pulsed current |
| DC-DC freewheeling diode replacement | Same topology as the synchronous rectifier, often above 100 kHz | 5 A to 20 A | Switching times, input capacitance |
| 12 V load switch | Low-side series device, gate pulled up through a resistor by an MCU | 1 A to 10 A | Threshold upper limit at 4.5 V drive |
A 60 V rating leaves margin on 12 V, 24 V and 48 V buses. Synchronous rectification and inductive load dump are the two cases that push voltage to the limit, which is why 60 V is chosen over 30 V.
Package and Pinout
| Item | CSD18563Q5A | VBGQA1606 |
|---|---|---|
| Package name | SON 5 × 6 mm | DFN8(5 × 6) |
| Body size | 4.9 × 5.75 mm nominal | 5 × 6 mm |
| Height | 1.0 mm nominal | Not listed |
| Pins 1–3 | Source | Source |
| Pin 4 | Gate | Gate |
| Pins 5–8 | Drain | Drain |
| Exposed pad | Drain | Drain |
The pin assignment is identical: source, gate and drain line up one to one, and the exposed pad is drain on both parts. A replacement drops into the same footprint in the same orientation. No cross-wiring and no gate-signal rerouting are needed.
Body length and width differ by 0.1 mm to 0.25 mm, within the same class of 5 × 6 mm leadless packages. Draw the land pattern to the narrower of the two recommended outlines and both parts will fit. Use a leadless reflow profile with a 260 °C peak.
The original datasheet also specifies an internal series gate resistance of 1.5 Ω typical and 3.0 Ω maximum. The replacement datasheet has no such entry; damping in the gate loop has to come from the external resistor.
On-Resistance Column and Test Current
| Item | CSD18563Q5A | VBGQA1606 |
|---|---|---|
| Test current at 10 V | 18 A | 20 A |
| Resistance at 10 V (typ / max) | 5.7 / 6.8 mΩ | 6.0 mΩ / not listed |
| Test current at 4.5 V | 18 A | 20 A |
| Resistance at 4.5 V (typ / max) | 8.6 / 10.8 mΩ | 7.0 mΩ / not listed |
| At 125 °C junction (10 V drive) | Curve only, no value listed | 9.0 mΩ typical |
| At 175 °C junction (10 V drive) | Curve only, no value listed | 12.0 mΩ typical |
Both replacement values sit in the typical column with the maximum column blank. Both original values have a maximum guarantee.
Typical to typical: at 10 V, 6.0 mΩ against 5.7 mΩ is 5% higher; at 4.5 V, 7.0 mΩ against 8.6 mΩ is 19% lower. The replacement was tested at 20 A rather than 18 A, which works in its favour.
Production designs need a worst-case value. With no maximum listed, add 20% to the typical: 7.2 mΩ, which is 6% above the original 6.8 mΩ maximum. The same treatment on the 4.5 V row gives 8.4 mΩ, below the original 10.8 mΩ maximum. The 10 V row is where the missing maximum guarantee matters.
The product page lists 5.3 mΩ and 6.5 mΩ, while the datasheet lists 6 mΩ and 7 mΩ. This article uses the datasheet values; the product page parameters need checking.
Gate-Charge Test Voltage
| Item | CSD18563Q5A | VBGQA1606 |
|---|---|---|
| Gate charge at 10 V (typ / max) | 15 / 20 nC | 34 / 40 nC |
| Test bus voltage | 30 V | 60 V |
| Test current | 18 A | 20 A |
| Gate-to-drain charge | 2.9 nC typical | 8 nC typical |
| Gate-to-source charge | 3.3 nC typical | 10 nC typical |
| Gate charge at 4.5 V | 7.3 / 9.5 nC | Not listed |
The replacement gate charge is more than twice the original. Both are datasheet values, and part of the difference comes from the test bus: gate-to-drain charge rises with voltage, so 30 V and 60 V are different operating points.
Scaling the gate-to-drain charge back to a 30 V bus gives roughly 4 nC for the replacement and about 30 nC total, still above the original 15 nC. The replacement is genuinely higher; the conversion does not reverse the result.
At 200 kHz, Qg × VGS × f gives 0.03 W for the original at 15 nC and 0.068 W for the replacement at 34 nC. Recheck the driver peak-current margin, especially on boards with parallel devices. The replacement datasheet has no 4.5 V gate-charge data, so that condition has to be measured.
Capacitance Bias Voltage
| Item | CSD18563Q5A | VBGQA1606 |
|---|---|---|
| Input capacitance | 1150 typ / 1500 max pF | 1800 pF typical |
| Output capacitance | 280 typ / 364 max pF | 400 pF typical |
| Reverse transfer capacitance | 3.9 typ / 5.1 max pF | 85 pF typical |
| Test bias | VDS = 30 V | VDS = 0 V |
| Maximum values | Listed | Not listed |
Input capacitance falls as drain-source voltage rises, and 0 V bias is where it is largest. The replacement reads 1800 pF at 0 V and the original 1150 pF at 30 V; part of that gap is only the bias difference.
Reverse transfer capacitance differs most: 85 pF against 3.9 pF. This value also depends on bias, but the replacement at 0 V is already an order of magnitude above the original maximum. Miller plateau length and false turn-on risk under dv/dt both depend on it, so recheck driver pull-down strength and dead time after the change.
The replacement leaves all three maximum columns blank, so production designs can only add margin to the typical values.
Switching Time and Gate Resistance
| Item | CSD18563Q5A | VBGQA1606 |
|---|---|---|
| Turn-on delay | 3.2 ns | 15 typ / 18 max ns |
| Rise time | 6.3 ns | 5 ns typical |
| Turn-off delay | 11.4 ns | 30 ns typical |
| Fall time | 1.7 ns | 20 typ / 30 max ns |
| Test bus voltage | 30 V | 60 V |
| External gate resistance | 0 Ω | 2.5 Ω |
| Internal gate resistance | 1.5 typ / 3.0 max Ω | Not listed |
Turn-on and turn-off delay on the replacement are about three times the original, and fall time is about ten times. External gate resistance changes from 0 Ω to 2.5 Ω and the bus from 30 V to 60 V; both lengthen the switching transition.
The original also has 1.5 Ω of internal gate resistance, which already damps the loop under 0 Ω external drive. The replacement has no internal resistor listed, so the board resistor sets damping: a small value switches faster but raises ringing and dv/dt, while a larger value raises switching loss.
There is no like-for-like comparison for these four rows. Comparing them on one driver board is the only reliable check.
Current Rating Basis and Thermal Resistance
| Item | CSD18563Q5A | VBGQA1606 |
|---|---|---|
| Continuous current at 25 °C case | 93 A silicon limited / 100 A package limited | 60 A package limited |
| Continuous current at 100 °C case | Not listed | 35 A |
| Continuous current on 1 in² 2 oz board at 25 °C ambient | 15 A | Not listed |
| Pulsed current | 251 A | 165 A |
| Max dissipation at 25 °C ambient | 3.2 W on 1 in² 2 oz board | 3 W steady / 8.3 W for 10 s |
| Max dissipation at 25 °C case | 116 W | 115 W |
| Junction-to-ambient, steady | 50 °C/W on 1 in² 2 oz board | 40 typ / 50 max °C/W |
| Junction-to-case | 1.3 °C/W max | 1.1 typ / 1.3 max °C/W |
| Junction temperature limit | 150 °C | 175 °C |
At case temperature the original looks much stronger: 93 A against 60 A. But 93 A is silicon limited and 100 A is package limited, while the replacement 60 A is also package limited. None of these is a current a board can sustain indefinitely.
On a board the original is rated 15 A with 1 in² of 2 oz copper. The replacement datasheet gives no ambient current, only 50 °C/W steady thermal resistance and 3 W dissipation. Working back from a 175 °C junction and 25 °C ambient gives 3 W; 6 mΩ corresponds to 22 A, and at 175 °C the resistance rises to 12 mΩ, corresponding to 15.8 A. That is the same order as the original 15 A.
Steady junction-to-ambient resistance is 50 °C/W maximum on both parts, and the replacement junction limit is 25 °C higher. At 60 °C ambient: (175−60)/50 = 2.3 W against (150−60)/50 = 1.8 W, so the replacement allows 28% more dissipation.
Body Diode and Avalanche
| Item | CSD18563Q5A | VBGQA1606 |
|---|---|---|
| Body-diode forward voltage (typ / max) | 0.8 / 1.0 V at 18 A | 1.0 / 1.5 V at 20 A |
| Reverse recovery time | 49 ns at di/dt = 300 A/µs | 35 ns at di/dt = 100 A/µs |
| Reverse recovery charge | 63 nC | Not listed |
| Single-pulse avalanche energy | 146 mJ at 54 A, L = 0.1 mH | 225 mJ at L = 0.1 mH |
| Avalanche current | Not listed | 30 A |
The replacement reverse recovery time is 14 ns shorter, but the test di/dt is one third of the original, so the times cannot be compared directly. The original also lists 63 nC of reverse recovery charge; the replacement datasheet has no such entry. Synchronous rectifier loss and voltage spikes track Qrr more closely than trr, so check the switching waveform after the change.
Avalanche energy is 54% higher on the replacement: 225 mJ against 146 mJ. The replacement row has no test current while the original specifies 54 A, so the conditions are not fully matched. The replacement separately lists 30 A avalanche current, which can be used to set a current limit.
Body-diode forward voltage is 0.2 V higher typical on the replacement. During dead time, that adds 0.2 V × current × duty cycle to the loss.
Threshold and 4.5 V Drive
| Item | CSD18563Q5A | VBGQA1606 |
|---|---|---|
| Threshold (min / typ / max) | 1.7 / 2.0 / 2.4 V | 1.0 / 2.0 / 3.0 V |
| Gate-source voltage rating | ±20 V | ±20 V |
| Overdrive at 4.5 V using threshold maximum | 2.1 V | 1.5 V |
Both typical thresholds are 2.0 V. The replacement spread is wider: the minimum is 0.7 V lower and the maximum 0.6 V higher. Using the maximum, 4.5 V drive leaves 2.1 V overdrive on the original and 1.5 V on the replacement.
On a 12 V bus the gate level is usually 10 V to 12 V, leaving more than 7 V of overdrive on both parts, so this row makes no difference there. At 3.3 V or 4.5 V drive, calculate from the threshold maximum and leave room for unit-to-unit spread.
Both parts are rated ±20 V gate-source. On a 24 V bus with the gate pulled to ground the rating is exceeded on both, so a clamp or divider is required in either case.
Three Options and When They Apply
First: 12 V or 24 V bus synchronous rectifiers and motor low sides, with 10 V or higher gate drive and switching frequency up to 200 kHz. A direct replacement works. The pinout matches, steady thermal resistance is 50 °C/W on both, and the 10 V typical resistance differs by 5%. Driver loss rises, so recalculate it from the replacement gate charge.
Second: 4.5 V drive or switching frequency above 500 kHz. Measure before committing. The replacement has twice the gate charge, a 0.6 V higher threshold maximum and 30 ns turn-off delay; all three eat into margin at high frequency.
Third: bridge circuits sensitive to dv/dt where false turn-on is controlled by the Miller plateau. Do not change to this part. The replacement reverse transfer capacitance is 85 pF at 0 V while the original is 3.9 pF at 30 V, with no matching-condition data to close the gap. VBGQA1603 in the same package is another route: 60 V, 90 A and 2.8 mΩ, again requiring its own datasheet check.
Full Parameter Comparison
| Parameter | CSD18563Q5A | VBGQA1606 |
|---|---|---|
| Package | SON 5 × 6 mm | DFN8(5 × 6) |
| Channel | N | N |
| Drain-source voltage | 60 V | 60 V |
| Gate-source voltage | ±20 V | ±20 V |
| Threshold (min / typ / max) | 1.7 / 2.0 / 2.4 V | 1.0 / 2.0 / 3.0 V |
| Resistance at 10 V (typ / max) | 5.7 / 6.8 mΩ | 6.0 mΩ / not listed |
| Resistance at 4.5 V (typ / max) | 8.6 / 10.8 mΩ | 7.0 mΩ / not listed |
| Continuous current at 25 °C case | 93 A silicon / 100 A package limited | 60 A package limited |
| Continuous current at 25 °C ambient, 1 in² board | 15 A | Not listed |
| Pulsed current | 251 A | 165 A |
| Gate charge at 10 V (typ / max) | 15 / 20 nC | 34 / 40 nC |
| Gate-to-drain charge | 2.9 nC | 8 nC |
| Gate-to-source charge | 3.3 nC | 10 nC |
| Input capacitance (test bias) | 1150 pF at 30 V | 1800 pF at 0 V |
| Reverse transfer capacitance (test bias) | 3.9 pF at 30 V | 85 pF at 0 V |
| Turn-on / turn-off delay | 3.2 / 11.4 ns | 15 / 30 ns |
| Body-diode voltage (typ / max) | 0.8 / 1.0 V | 1.0 / 1.5 V |
| Reverse recovery charge | 63 nC | Not listed |
| Avalanche energy | 146 mJ | 225 mJ |
| Junction-to-ambient, steady | 50 °C/W | 40 typ / 50 max °C/W |
| Junction-to-case | 1.3 °C/W max | 1.1 typ / 1.3 max °C/W |
| Junction temperature range | −55 to 150 °C | −55 to 175 °C |
| Internal gate resistance | 1.5 typ / 3.0 max Ω | Not listed |
Other Options at the Same Voltage
VBGQA1603 is a 60 V N-channel device in the same package, rated 2.8 mΩ at 10 V and 90 A at 25 °C case. Resistance is roughly half this part's, at the cost of checking its own gate charge and capacitance values. Use it above 30 A load current; the land pattern stays the same.
VBQA1308 is a 30 V N-channel device in the same package, rated 7 mΩ and 80 A. The voltage rating is half, so it only applies on buses up to 24 V. The lower voltage class usually buys lower on-resistance.
Staying with the original is also an option. Gate charge, reverse recovery charge and switching time have no matching-condition comparison between the two parts, so an existing 10 V, sub-15 A design has a lower verification cost if it stays put.
Checks Before Replacement
- Pinout: pins 1–3 source, pin 4 gate, pins 5–8 drain, exposed pad drain on both parts. Same-orientation drop-in.
- Resistance: the replacement lists typical only. Use 7.2 mΩ, the typical 6.0 mΩ plus 20%, as the design value and confirm the maximum with the supplier.
- Product page parameters: it lists 5.3 mΩ and 6.5 mΩ while the datasheet lists 6 mΩ and 7 mΩ. Use the datasheet.
- Gate charge: 34 nC on the replacement was measured on a 60 V bus, 15 nC on the original at 30 V. Recalculate driver peak current from the replacement.
- Capacitance: replacement reverse transfer capacitance is 85 pF at 0 V. Check for false turn-on in bridge circuits on the bench.
- Switching times: external gate resistance and bus voltage differ, so there is no matching data. Measure in the actual driver circuit.
- Gate resistance: 1.5 Ω internal on the original, not listed on the replacement. Select the external gate resistor for the replacement.
- Body diode: reverse recovery charge is not listed for the replacement. Look at the switching waveform rather than the time parameter alone.
- Current: the replacement 60 A is at 25 °C case and package limited. Without a heatsink, the steady current is around 15 A from 50 °C/W.
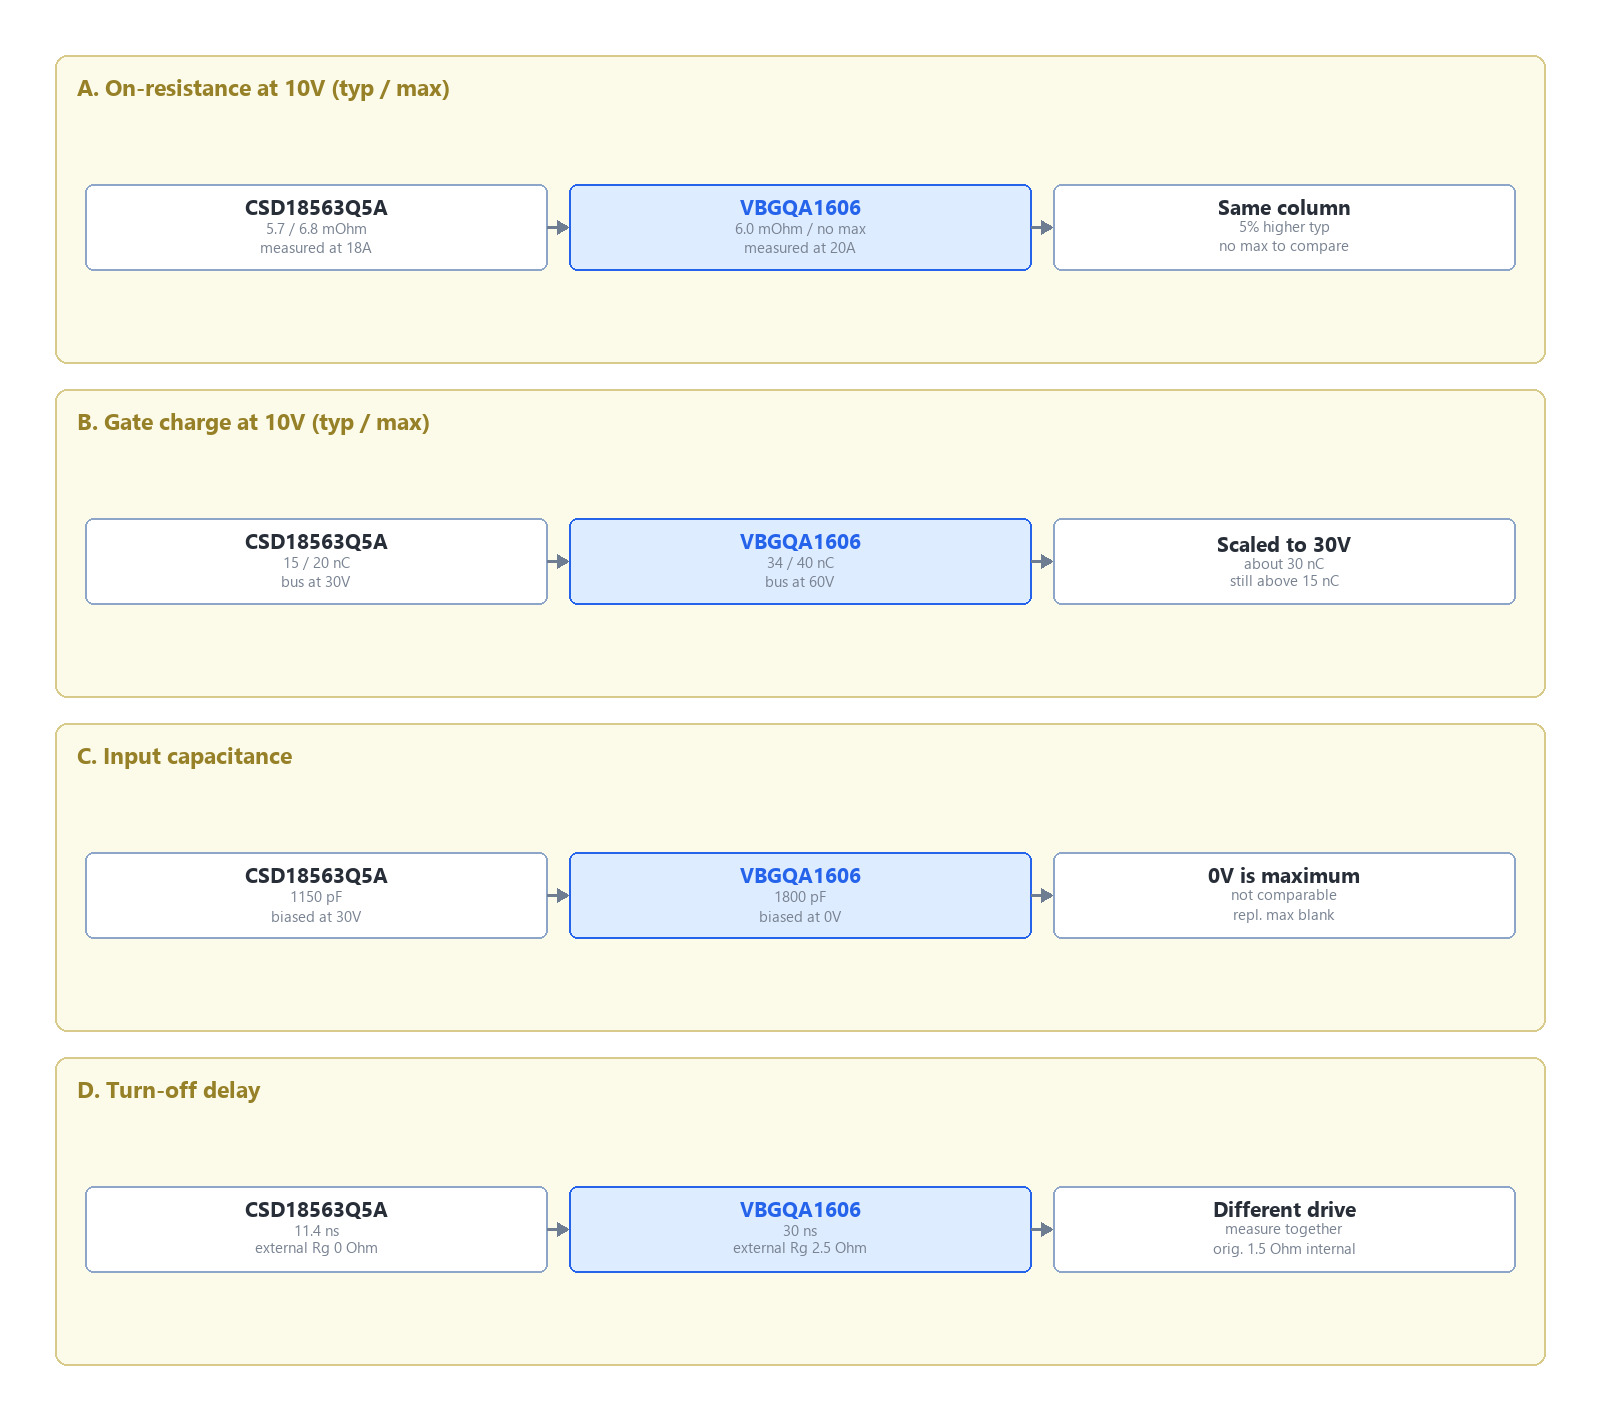
Figure 1. Four rows of datasheet values side by side. On-resistance at 10 V: 5.7 / 6.8 mΩ against 6.0 mΩ with no maximum listed. Gate charge: 15 / 20 nC measured at 30 V against 34 / 40 nC measured at 60 V. Input capacitance: 1150 pF at 30 V against 1800 pF at 0 V. Turn-off delay: 11.4 ns against 30 ns, with external gate resistance of 0 Ω and 2.5 Ω respectively.
FAQ
Is the pinout the same on both parts?
Yes. Both use pins 1–3 for source, pin 4 for gate and pins 5–8 for drain, with the exposed pad tied to drain. Drop the replacement in with the same orientation; no cross-wiring is needed.
Can 6 mΩ on the replacement be treated the same as 5.7 mΩ on the original?
The typical values are 5% apart, but the original guarantees a 6.8 mΩ maximum and the replacement maximum column is blank. For production, use 7.2 mΩ, the typical value plus 20%.
Why is the replacement gate charge 34 nC against 15 nC on the original?
Part of it is the test bus: 60 V for the replacement and 30 V for the original. Scaled back to 30 V using gate-to-drain charge, the replacement is about 30 nC, still above the original. Recalculate driver loss from the replacement value.
Can 1800 pF and 1150 pF input capacitance be compared directly?
No. The replacement was measured at VDS = 0 V and the original at 30 V, and input capacitance is largest at 0 V. Matching-condition values are not listed.
Does three times the switching time mean the replacement is much slower?
The conditions differ: 0 Ω external gate resistance and 30 V bus for the original, 2.5 Ω and 60 V for the replacement, plus 1.5 Ω internal gate resistance on the original. Compare them on the same driver board.
Can the 225 mJ avalanche rating substitute for the original 146 mJ?
The replacement row has no test current while the original specifies 54 A, so the conditions are not fully matched. The replacement lists 30 A avalanche current, which can set a current limit.
What are the risks of a direct swap in a synchronous rectifier?
The replacement does not list reverse recovery charge, and its recovery time was measured at a lower di/dt. Check the switching waveform and voltage spikes rather than the time parameter alone.

Download PDF document
 Download now


